
The Architecture of Privacy Loss
A living experiment in total visibility. How one home network quietly captures, pipes, and publishes every moment of a day — and why you’re probably doing it too.
The Premise: A House That Watches Itself
Privacy is dead. Not metaphorically—literally. Every device in your home, every device on your person, is collecting data. Corporations profit from it. Governments request it. And most of us have surrendered to this inevitability without ever really understanding the shape of the machinery that surrounds us.
But what if you owned the machinery?
Life of Bryan is an experiment: a fully instrumented home network that captures, processes, and publicly displays the rhythms of a day. Steps taken. Location changes. Photos snapped. TV watched. Health metrics. Meal timing. Sleep cycles. All of it flows through a private infrastructure—from mobile devices to local servers to a public-facing website—with zero intermediaries and total transparency about what’s happening.
It’s not about surveillance. It’s about ownership. The goal is to answer a simple question: What happens when you refuse to be a product, and instead become the architect of your own visibility?
Privacy is dead. But ownership is not. The question is: who owns the data about your life?
The Network Layer: Where It All Starts
The infrastructure is built on a private, isolated subnet: a family of devices networked together with only one rule: everything routes through local servers first. No data reaches external services without explicit permission.
The network consists of three primary server nodes, each with a specific role. The primary workhorse runs the core automation services—everything from DNS filtering and reverse proxying to media distribution and smart home orchestration. A secondary server handles redundancy, backup, and specialized tasks like local AI processing. A third node (a mobile phone, permanently stationed) acts as a dedicated automation relay, running custom scripts to bridge cloud services with home automation without exposing the primary infrastructure.
All three nodes are connected via a mesh VPN overlay, creating an encrypted tunnel even within the same physical home. This layer of indirection matters: it means every connection is authenticated, logged, and traceable. It’s not paranoia—it’s observability.
The Reverse Proxy Layer
Nothing reaches the internet without passing through a reverse proxy. This proxy sits between your internal network and the public web, acting as a gatekeeper. It handles SSL termination, request logging, authentication, and routing. More importantly, it’s the choke point where policy lives: it decides who gets in, what they can access, and how much of your infrastructure is even visible from the outside.
For public services—like the website itself—traffic flows through this proxy. For internal-only services (photo library, personal automations, health tracking), the proxy flat-out denies access from external IPs. No exceptions.
DNS as the Invisible Border
DNS is where the magic happens. A local DNS server runs on the primary infrastructure node, but it’s not just serving names—it’s filtering. Advertising networks. Tracking domains. Known malware hosts. All of it gets blackholed before it ever reaches a device. Every DNS query is logged, creating a perfect audit trail of what every device on the network is trying to connect to.
When you control your DNS, you control your network’s outbound behavior. This is where privacy is defended—not through firewalls, but through denial.
The Data Inflow Pipeline: Five Distinct Streams
Data enters the system from five primary sources. Each has its own pipeline, its own processing logic, and its own endpoint.
Stream 1: Mobile Health & Location
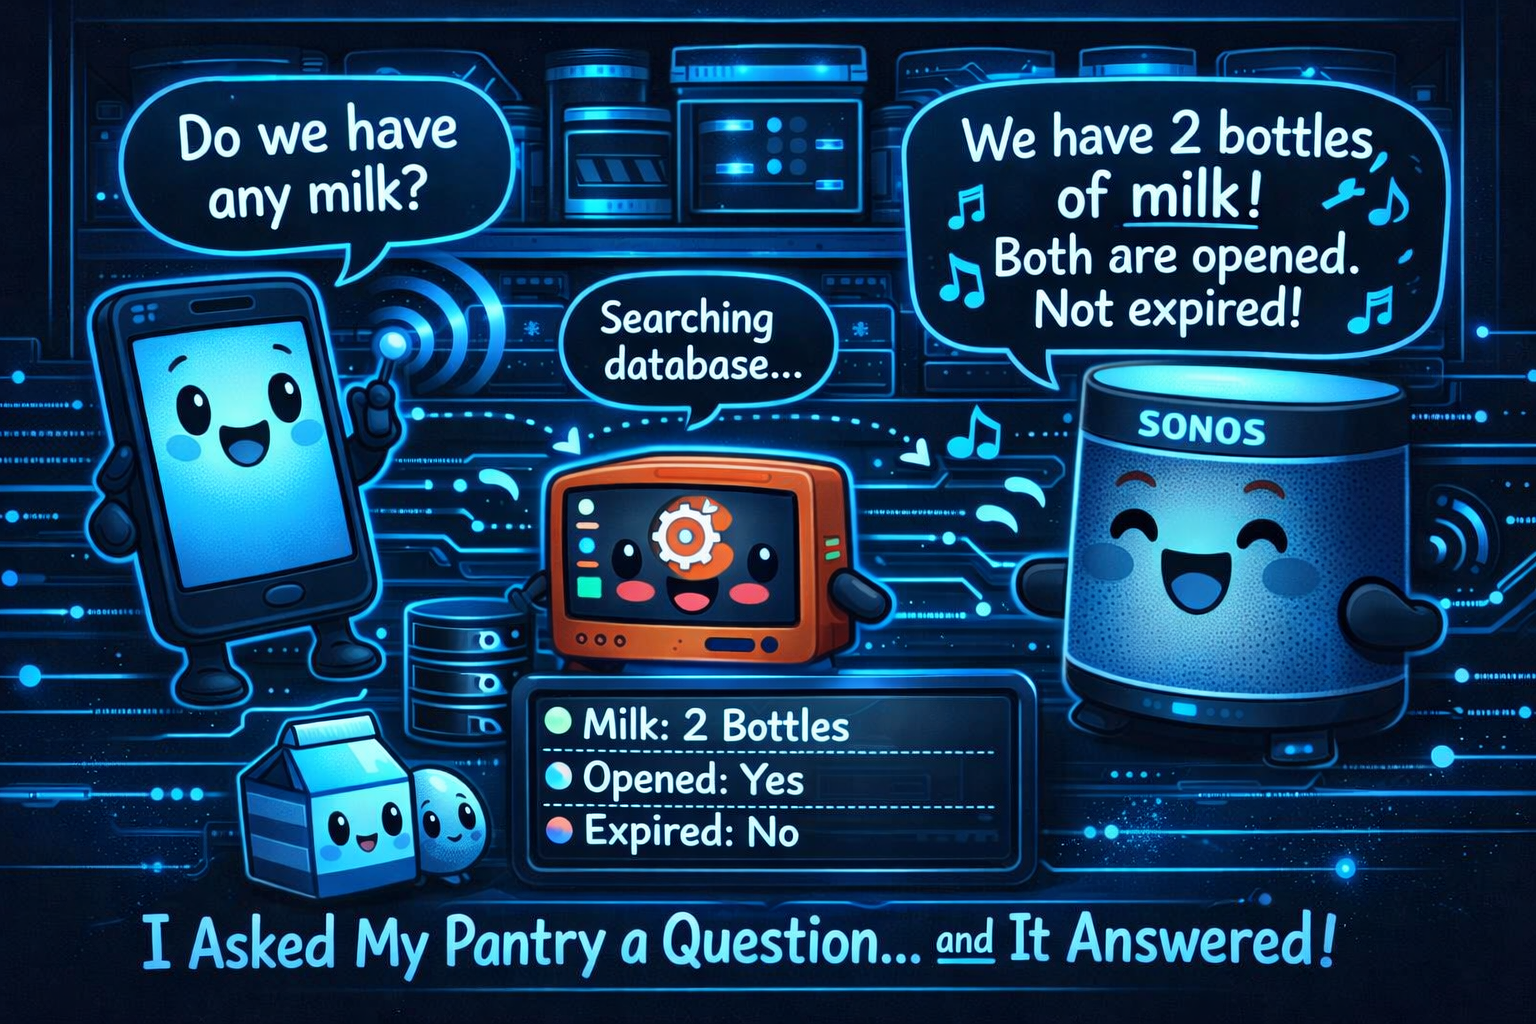
A smartphone runs a custom automation framework. Every minute, it polls the phone’s built-in sensors: accelerometer data (step count), GPS coordinates, and whether a screen is locked or active. These raw values get posted to a local server endpoint, which accumulates them into daily tallies.
Location is granular—down to which room of the house or which named GPS coordinate. This is used for zone-based automation: when you enter the home, certain scenes trigger automatically. When you leave, others. Time-of-day presence combined with location data allows the system to reason about what you’re probably doing.
The smartphone also captures photos—specifically, a single photo each time you move to a new location. These photos flow through a local image pipeline where they’re watermarked, archived, and (optionally) published to the website as a timeline-of-the-day feed.
Stream 2: Nutrition & Wellness
A nutrition app on the phone tracks food intake throughout the day. But the goal isn’t just logging—it’s integration. This data flows out of the closed app into a system called Health Connect, which acts as a vendor-neutral broker. From Health Connect, a local automation pulls the data every minute and posts it to another local API endpoint.
As the day progresses, daily calorie intake accumulates. When you hit 75%, the system announces a gentle reminder through the home’s speaker. At 90%, another announcement. At 100%, a celebratory message. This turns a private health metric into an ambient, spoken part of the home environment.
The 30-day rolling archive of nutrition data is available as a JSON feed on the website, allowing visitors to see not just today’s intake but the full weekly context.
Stream 3: Television & Media
Every device in the home capable of playing media reports back to a central server: what’s currently playing, on what device, from which service. Plex (local media server), streaming apps, even live TV from a dedicated tuner—all of it flows into a unified “now playing” system.
This data is transformed and pushed to the website, creating a live feed showing exactly what’s being watched at any moment. For privacy-conscious visitors, the actual title can be obfuscated. But the raw data is captured and archived.
Stream 4: Vehicle Telemetry
A vehicle diagnostics app on the phone reads real-time OBD (on-board diagnostic) data whenever the car is running. Engine temperature, RPM, fuel consumption, location, speed—all of it gets transmitted to a local server that normalizes the data and logs it as a KML file (geographic data format).
This creates a 3D timeline of every trip: where you went, how fast you were driving, how long you spent idling. A live map on the website shows current vehicle location and status. It’s live telemetry, like a public flight tracker for your car.
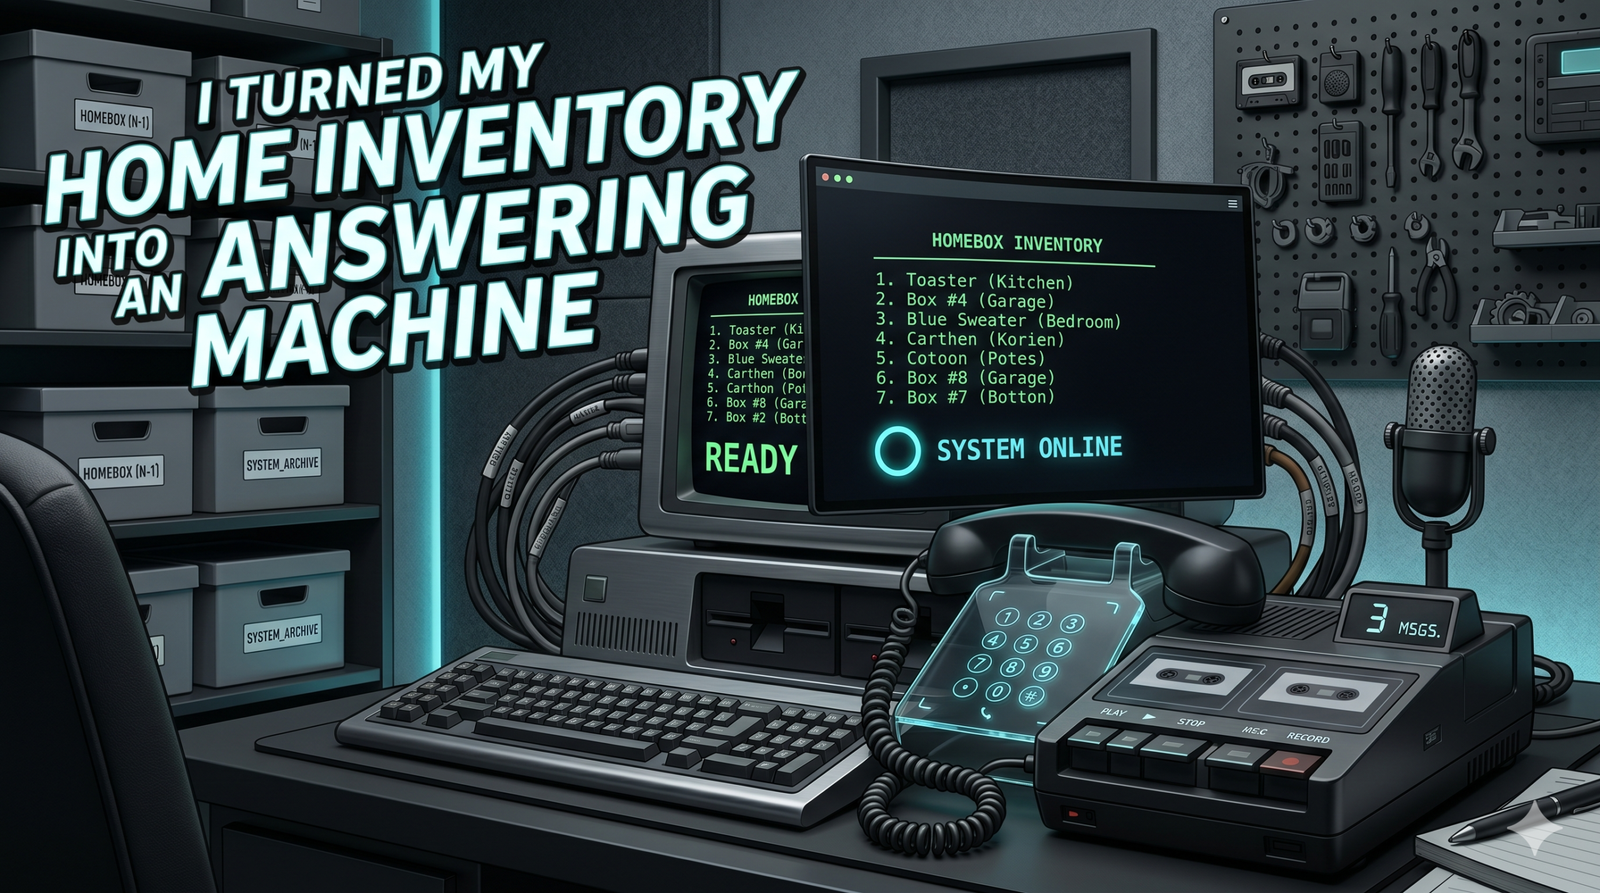
Stream 5: System Health & Uptime
Every service, every device, every network component is monitored for health. 34 separate monitors check if devices are reachable, if services are responding, if APIs are alive. When something breaks, alerts flow through multiple channels: push notifications, voice announcements, and a public status dashboard.
The uptime system is redundant: a primary monitor on one server, a backup instance on a secondary server. If the primary goes down, the backup takes over transparently. The public status page updates every 5 minutes, showing which services are green and which have degraded.
The Processing Layer: Where Raw Data Becomes Intelligence
Raw data is useless. It only becomes valuable when it’s processed, correlated, and transformed. This is where the local server infrastructure earns its complexity.
Real-Time Aggregation
Data arrives in micro-bursts: a location ping every minute, a nutrition update every few minutes, a photo capture every 20 minutes. The system maintains in-memory accumulators (simple JSON objects) that merge these events into a unified current state. When the state changes—you enter a new room, hit a nutrition milestone, start playing new media—downstream subscribers are notified.
This is not database-heavy. It’s stream-oriented. The state lives in memory for speed, backed up to persistent storage (both local and cloud) periodically. The design is optimized for low latency and high throughput, not for historical queries.
Home Automation: Intent Mapping
A dedicated home automation system (Home Assistant) orchestrates smart home devices: lights, locks, thermostats, speakers. But Home Assistant doesn’t live in isolation—it’s fed a continuous stream of state updates from the processing layer above.
When location data indicates you’ve moved into the bedroom at night, Home Assistant automatically dims lights. When the system detects you’ve left home for work, it arms security devices and disables non-essential services. When nutrition data shows you’ve finished a meal, the kitchen’s smart speakers can announce a digest of the meal and nutritional impact.
These automations are self-contained rules, but they’re triggered by a unified data model. One truth about the current state, flowing from multiple sensors into one decision engine.
Transformation & Publication
Multiple services need to consume this data in different formats. The website needs JSON. Home Assistant needs REST API calls. Mobile push notifications need structured payloads. Rather than scatter transformation logic everywhere, a series of lightweight transformation daemons listen to the unified state stream and emit specialized formats.
For example: raw nutrition data becomes a JSON feed (for the website), a REST payload (for Home Assistant), and a text summary (for voice announcements). One source, three outputs, zero duplication.
The Output Layer: Publishing Your Private Life
The most controversial part of the system: by design, much of this data is public. Your location. Your meals. What you’re watching. Your vehicle’s telemetry. All of it is accessible to anyone visiting the main website.
This is intentional. The goal isn’t to hide—it’s to own your own visibility. Rather than surrender this information to a dozen different platforms and hope they keep it secure, you publish it yourself under your own terms, with total knowledge of what’s exposed and what isn’t.
The Website: A Living Dashboard
The primary output is a website that updates in near real-time. Multiple custom plugins and integrations pull data from the internal API and display it:
Each dashboard element is backed by a simple JSON file hosted on the web server. The website’s JavaScript fetches these files periodically, updating the UI without needing a full page reload. Visitors see fresh data, refreshed every few minutes.
There’s no login. No authentication. No “member area.” If you’re visiting the website, you’re seeing the same data as everyone else. This is the opposite of most personal sites, which hide everything behind authentication walls. This site assumes the default is open.
The Feedback Loop: Devices Announcing Status
In addition to publishing to the web, the system also “announces” state changes back into the home environment. When a nutrition goal is hit, the home’s speakers say it. When a system fails, a phone notification fires. When a location change is detected, a visual indicator might trigger.
This creates a continuous feedback loop: data flows in, gets processed, flows back out as both web updates and ambient home notifications. You’re not just passively recording—you’re creating an environment that’s aware and responsive.
The Resilience Question: What Happens When It Breaks?
A system this complex will fail. Servers crash. Networks go down. Services get exploited. The design accounts for these failures through redundancy and graceful degradation.
Redundancy Pattern
Critical services run on at least two separate servers. The monitoring system itself has a primary instance and a backup. DNS has redundancy. Backup data flows to both local storage and cloud services. If one server fails, the system keeps running on the other.
The trade-off: more complexity, more moving parts, more potential failure modes. But the failure mode when a single server dies is “degraded service,” not “total outage.”
Data Persistence
Raw data is captured and archived in multiple places. Cloud storage (Google Drive) for long-term backup. Local NAS storage for quick access. Some data is immutable—photos, historical location traces. Other data is ephemeral—current state, live feeds—and can be regenerated.
The philosophy: capture everything, validate later. If a sensor sends bad data, it’s still logged. But the processing pipeline checks for sanity and drops outliers.
The Privacy Paradox: Owning vs. Surrendering
The reason this system exists is the paradox at the heart of modern privacy: you can’t hide from data collection. Devices are collecting data whether you permit it or not. Corporations are profiting from it. The only choice is who controls the data.
Option A: Let your devices collect data and ship it to cloud services. You get convenience. They get a profile. You lose visibility into what’s being collected and who can access it.
Option B: Disable collection entirely. You get privacy at the cost of functionality. No smart home. No health tracking. No insights. Pure darkness.
Option C: Collect the data yourself, own the infrastructure, and decide what’s public. This is harder. It requires expertise, hardware investment, and ongoing maintenance. But it trades surveillance for sovereignty.
Privacy is not about hiding. It’s about ownership. Who controls the data about your life?
Life of Bryan chooses Option C. The site makes a statement: I collected this data. I own it. And I’m showing you exactly what I think is interesting.
The irony is thick: in order to own your privacy, you must make radical decisions about what not to hide. You build infrastructure that is intentionally transparent. You publish data that most people would kill to keep secure. You create something that looks, from the outside, like the opposite of privacy.
But the control is yours. No algorithm decides what you see. No company profits from your location data. No platform predicts your behavior to sell you products. You are not the product. You are the architect.
Why This Matters: The Future of Visibility
As devices become smarter, cheaper, and more pervasive, the question of who owns your data will only become more urgent. The systems built today—personal clouds, local automation, self-hosted services—are not niche hobbies. They’re previews of the infrastructure choices we’ll all be forced to make.
Companies have spent a decade convincing us that convenience requires surrender. That you can’t have a smart home without letting Amazon into it. That health tracking requires shipping your data to Silicon Valley. That a connected life means a compromised life.
Life of Bryan proves otherwise. It’s messier. It requires more work. But it’s possible.
The architecture described here isn’t unique to this one person’s setup. The building blocks—local servers, open-source software, mesh VPNs, reverse proxies, automation engines—are all available to anyone with the technical knowledge and the will to wire them together.
As we careen toward a future where everything is connected, the question isn’t whether your devices will be collecting data. They will be. The question is: who will own the infrastructure that collects it?
This site is one answer.
Leave a Reply